Drinking Water Quality Monitoring: From Sampling to System-Level Insight
Drinking water quality is not established by a single test. It is monitored through a combination of microbiological indicators, operational measurements, sampling locations, laboratory analysis, historical records, and risk-based management.
Drinking water moves through a system that can include source water, treatment, storage, transmission and distribution. Monitoring therefore has to provide evidence about conditions at relevant points throughout that system — from the catchment to the consumer's tap, as the WHO's water safety planning approach puts it.WHO GDWQHealth Canada
The central idea of this page: a water-quality result is much more useful when it can be understood in its full context — what was sampled, where it was sampled, when it was sampled, how it was handled, what was measured, and how the result relates to other observations.
Part 1 · What is measured
Drinking Water Quality Is a Multi-Parameter Monitoring Problem
No single measurement provides a complete picture of drinking-water quality. Monitoring programs combine several categories of measurement, each answering a different question.
Microbiological indicators
E. coli, total coliforms and, where appropriate, other indicator organisms. Indicators are used because testing for every possible pathogen in every sample is impractical: indicators are organisms that can be reliably measured and whose presence or change points to conditions that warrant attention.
Operational / physical parameters
Disinfectant residual, turbidity, temperature and, where relevant, pH. These measurements say something about treatment performance and distribution-system conditions, and they can change before microbiological results do.
Chemical parameters
Depending on the source, treatment process, local risks and regulatory requirements, programs may monitor a wide range of chemical parameters — from naturally occurring constituents to treatment by-products. No single list fits every system.
An indicator result should be read for what it is: evidence about conditions. A negative indicator result does not prove the absence of every pathogen — it means the indicators measured were not detected by the method used.WHO GDWQHealth CanadaRoshan Water
WHO's Guidelines for Drinking-water Quality frame this as a risk-based system: health-based targets, water safety plans, operational monitoring and surveillance working together rather than any one measurement standing alone.WHO GDWQ
Part 2 · Microbiological testing
Why E. coli and Total Coliforms Matter
Most waterborne pathogens are hard to measure directly, one by one, in routine samples. Microbiological testing therefore relies on indicator organisms.

E. coli: an indicator of fecal contamination
Health Canada identifies E. coli as a useful indicator of fecal contamination because it occurs in human and animal feces and can be measured in water.Health Canada — E. coli
E. coli is an indicator of fecal contamination — not a measurement of every possible pathogen in the water.
A confirmed E. coli detection in a drinking-water system is treated as a serious signal requiring investigation and follow-up, but the test itself is an indicator measurement, not a pathogen inventory.
Total coliforms: a change detector
Total coliforms serve a different purpose. Health Canada's guidance uses them as an indicator of changes in water quality and of treatment or distribution-system conditions — a detection in the distribution system can point to bacterial regrowth, intrusion or similar conditions, and should be interpreted in context rather than read as a confirmed health hazard on its own.Health Canada — Total coliforms
The U.S. EPA's Revised Total Coliform Rule uses total coliforms the same conceptual way — as indicators that trigger assessment and follow-up. That is a U.S. federal requirement and applies to systems subject to it; it is not a universal rule for Canadian systems.U.S. EPA RTCR
What each indicator can — and cannot — tell you
| Indicator | What it can tell you | What it does not tell you |
|---|---|---|
| E. coli | Evidence relevant to fecal contamination | The presence or absence of every pathogen |
| Total coliforms | Changes in microbiological quality and distribution or treatment conditions | A direct measure of health risk by itself |
| Disinfectant residual | Whether disinfectant protection is present | Complete microbiological safety by itself |
| Turbidity | Physical clarity; treatment or distribution condition | Absence of pathogens |
Part 3 · Operational parameters
Chlorine Residual and Turbidity Add Operational Context
Microbiological results arrive days after sampling. Operational parameters can be measured in the field, at the tap, as often as needed — which is exactly why they anchor day-to-day distribution monitoring.
Disinfectant residual
Health Canada's chlorine guideline technical document notes that maintaining a disinfectant residual through the distribution system can help control microbial regrowth and provides an indication of changes in water quality or of distribution-system integrity — for example, where water age or system conditions cause the residual to decline.Health Canada — Chlorine
A decreasing residual is an operational signal that warrants investigation: main break, stagnant zone, cross-connection, changed demand. It is not, by itself, proof of contamination — and no single target concentration applies to every jurisdiction and system.
Turbidity
Turbidity is an operational/physical parameter used alongside microbiological and disinfection measurements — a measure of physical clarity that reflects treatment performance or distribution conditions. Low turbidity alone does not demonstrate microbiological safety.Health Canada — Operational parametersHealth Canada — Summary tables
Part 4 · Sampling
Sampling Location Is Part of the Result
A measurement without its location is an incomplete observation. Where a sample came from determines what the result can be compared against and what it can mean.
A sampling plan reflects the system, not a formula
Health Canada's guidance on operational parameters and on total coliforms is explicit that sampling location and frequency should reflect local conditions — system size, source, treatment and distribution characteristics — rather than one universal formula applied everywhere.HC — Operational parametersHC — Total coliforms
In the United States, the Revised Total Coliform Rule requires systems subject to it to follow an approved sample siting plan, with repeat samples after a positive result. That is a U.S. federal requirement — useful context, not a rule that applies to Canadian systems.U.S. EPA RTCR
Part 5 · The laboratory workflow
What Happens Between Collecting a Sample and Receiving a Result?
Every laboratory number is the end of a chain of physical and administrative steps. Weakness at any stage shows up as uncertainty in the result.
Handling affects the measurement
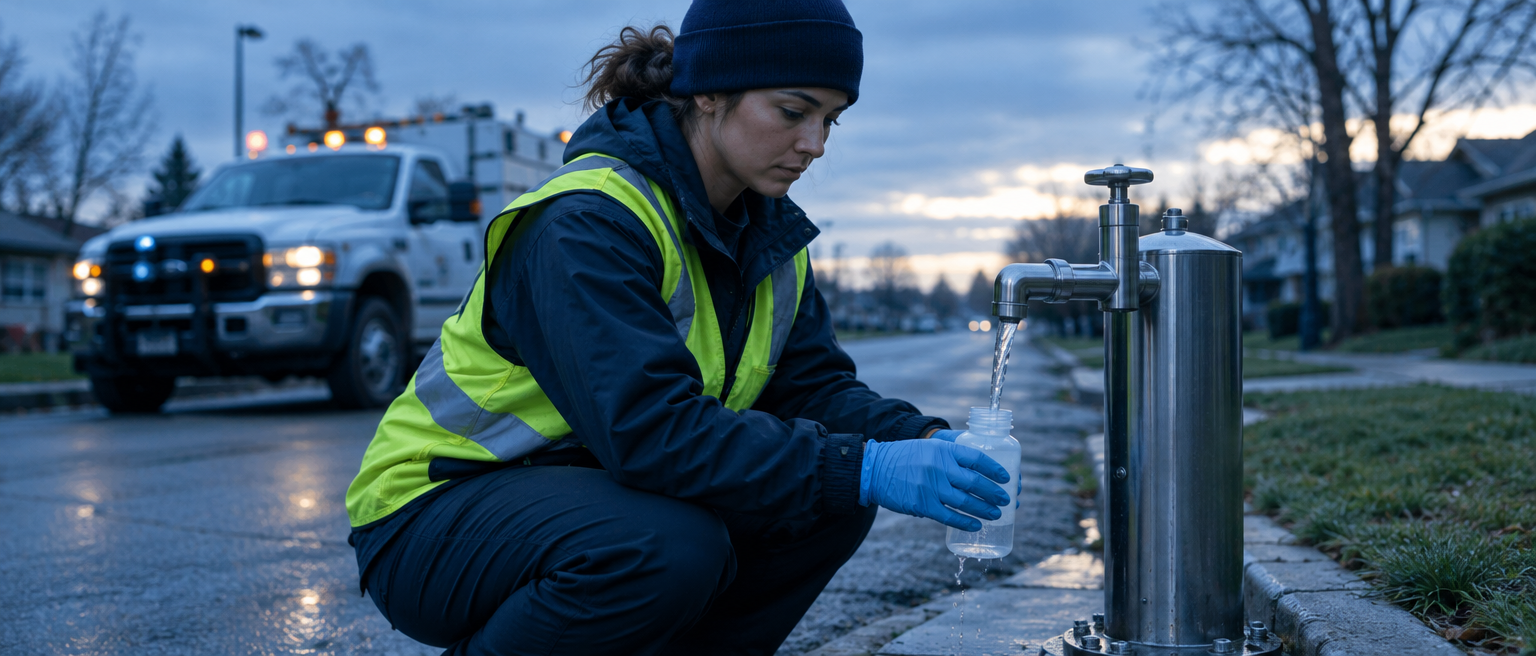
For microbiological samples, Health Canada's guidance is direct: samples should be collected using appropriate containers and procedures and transported under controlled temperature conditions, because storage and transport can affect microbial populations — and therefore the number the laboratory reports.HC — E. coliHC — Total coliforms
In practice that means: sample a representative flow, don't contaminate the container or cap, keep the sample cool and dark, record the collection time, and get it to the laboratory within the holding time the method and jurisdiction call for. A result from a sample that sat in a hot truck is not the same result.
Field testing and the central laboratory
Central laboratories remain an important part of water-quality programs: accredited methods, QA/QC systems and specialized analysis live there. Portable and distributed testing can complement laboratory workflows for time-sensitive or geographically distributed applications — but complement is the operative word, not replace.Roshan WaterWHO
Disinfectant residual and turbidity are natural field measurements; confirmatory microbiological analysis typically goes to the laboratory. The two streams describe the same water — which is exactly why they need to stay connected as records.
Part 6 · Traceability
A Laboratory Result Is Only Useful If You Know What It Belongs To
The identity of a sample is not paperwork around the measurement. It is part of the measurement's meaning.
What a traceable record carries
- Unique sample identifiers, assigned once and never reused
- Consistent location identifiers, so this year's data can be compared with last year's
- Collection timestamps, including transport-relevant timing
- Collector or operator information
- Requested analyses, recorded before the sample ships
- Field observations — weather, flow condition, anything unusual at the tap
- Laboratory accession and result information
- Documented sample handling: preservation, temperature, chain of custody
Traceability is not administrative overhead. It is part of the evidence behind the result.
When an investigation starts — a detection, a complaint, a declining residual — the first question is always "what do we know about this sample?" A result that cannot be tied to its point, time and handling cannot support follow-up decisions. Health Canada's guideline documents treat proper sample handling and identification as part of producing a valid measurement, not as an optional extra.
Part 7 · Monitoring over time
One Sample Tells You Less Than a Pattern
A distribution system varies in space and in time. The same parameter can differ between locations, between seasons, after maintenance, after operational changes, after unusual events, and with demand — across different parts of the network.
Total chlorine residual (mg/L) at three sampling locations, eight weeks
Illustrative example — not regulatory data and not a real water system.- Plant effluent
- School main
- North dead-end main
The point of this chart is not the exact values — they are illustrative. The point is what repeated measurements make visible: a stable location (the plant effluent), a location with ordinary variation, and a location showing a gradual decline across the whole period. That third pattern is the one that earns an investigation: water age, stagnant flow, a closed valve, demand changes.
Health Canada's chlorine and operational-parameters guidance treats a declining residual as an operational signal to investigate — a chart narrows down where and when to look, but it does not by itself determine the cause.HC — ChlorineHC — Operational
Part 8 · Interpretation
Water Quality Data Becomes More Useful When It Can Be Viewed in Context
A single result answers one question at one tap. Value accumulates as results are connected — and eventually become the basis for investigation and preventive action.
Time
How are results changing — this week, this season, this year?
Location
Where are results occurring — one tap, one pressure zone, the whole system?
Parameter
Which measurements are moving together, and which are not?
Water system
Is the pattern isolated to one system, or showing up across several?
Operational context
What was happening in the system when the measurement was collected?
WHO's water safety planning framework treats this as the point of monitoring: data feeds operational monitoring and verification, which feed management decisions and corrective action.WHO — WSPWHO GDWQVisualization supports investigation and interpretation — it does not replace professional judgment, approved analytical methods, or regulatory requirements.Health Canada
The Hard Part Is Often Connecting the Data
A drinking-water monitoring program generates many kinds of records, and they do not all start in the same place:
When these live in disconnected workflows, teams spend real effort on the connections instead of the water: matching sample IDs, checking duplicates, reconciling locations, moving results between files, hunting through historical records, rebuilding charts and reassembling recurring reports.
None of this is a scientific problem — the measurements are fine. It is an information-management problem, and it scales with the number of sampling points, parameters, laboratories and reporting cycles the program carries.
Part 10 · A better workflow
Design the Data Workflow Around the Sampling Workflow
The sampling workflow already exists — crews already go to points, collect, measure, ship and report. A good digital workflow follows that same path, instead of forcing field records and laboratory results into unrelated datasets.
The design principle is simple: preserve the relationship between the sample and its context. If the field record, the laboratory result and the sampling point are connected from the start, then review by time, location, parameter and system becomes a query — not a spreadsheet exercise.
See the Drinking Water Sampling Form
This is the actual "Drinking Water Distribution System" starter template — a sampling form with water system, sampling point, sample ID, field measurements and lab parameters, animating from a blank form to a filled submission. The phone is shown at real phone proportions — swipe or drag inside it to scroll the whole form.
CRD Drinking Water Distribution System
Water System*
SP Code*
SP Descriptions
SP Location*
Sample ID*
Date*
Time*
Water Temp (°C)*
Total CL2 Res (mg/L)*
Total Coliforms
E. coli
Turbidity
CRD Drinking Water Distribution System
Central Saanich Distribution System
CES-BR-09
Grieg Ave @ Grieg Pl (QC1 in meter box)
48.56701, -123.45209
SAM-2025-04757
2025-06-26T00:00:00.0000000Z
13:00:00
16.5
1.23
—
—
—
Report ready: Water Distribution Compliance Record
Part 11 · Where digital data management fits
Where Digital Data Management Fits
The scientific and regulatory requirements of drinking-water monitoring do not disappear when the workflow becomes digital. The opportunity is to make the information supporting those requirements easier to capture, connect, review, and reuse.
aQRate is a field data collection and management platform that can support drinking-water monitoring workflows by connecting structured field records, sampling locations, laboratory information, historical records, and reporting and visualization outputs in one dataset.
What aQRate does not replace
- laboratory analytical methods
- regulatory requirements
- qualified laboratory personnel
- water-quality professionals
- GIS systems where a full GIS is required
- SCADA / control systems
- regulatory reporting systems
It provides a data-management layer around the field-to-report workflow — nothing more, and that is the point.
References
Sources & Further Reading
This page summarizes and links to the guidance it draws on. Wherever jurisdiction-specific requirements appear, they are identified as such; general principles are cited to WHO and Health Canada.
This page is educational information. It does not replace current regulations, approved analytical methods, or qualified professional guidance — monitoring and compliance decisions should follow the requirements and guidance that apply in your jurisdiction.